Training DeepSeek V3 on 24× A100s — Part 6: Prometheus + Grafana Monitoring
Enable Ray metrics, wire up Prometheus, and import the official Grafana dashboard for real-time visibility during DeepSeek training.
This post shows the exact steps I used to expose Ray metrics to Prometheus and visualize them with Grafana while running DeepSeek training.
1) Start Ray with metrics export and launch Prometheus
# Clean slate
ray stop
ray metrics shutdown-prometheus

# Start Ray head with metrics export (Prometheus scrape endpoint)
ray start --head --metrics-export-port=8080

# Launch Prometheus that auto-scrapes the Ray endpoint
ray metrics launch-prometheus
Notes:
- The metrics endpoint listens on port
8080on the head node. - The
launch-prometheuscommand brings up Prometheus with a working scrape config for Ray.
2) Import the official Ray Grafana dashboard
Using the Grafana UI:
- Open your Grafana:
http://<your-ip>:3000 - Click "+" → "Import"
- In "Import via grafana.com", enter dashboard ID:
14708 - Select your
Prometheusdata source and click "Import"
Alternatively, import programmatically using the dashboard JSON that Ray writes:
cp /tmp/ray/session_latest/metrics/grafana/dashboards/default_grafana_dashboard.json ~/

python3 - <<'PY'
import json, requests
with open('/tmp/ray/session_latest/metrics/grafana/dashboards/default_grafana_dashboard.json','r') as f:
    dashboard = json.load(f)
payload = {
    "dashboard": dashboard,
    "overwrite": True,
    "inputs": [{
        "name": "DS_PROMETHEUS",
        "type": "datasource",
        "pluginId": "prometheus",
        "value": "Prometheus"
    }]
}
r = requests.post('http://admin:admin@localhost:3000/api/dashboards/db', json=payload,
                  headers={'Content-Type': 'application/json'})
print(r.status_code, r.text)
PY
Screenshots
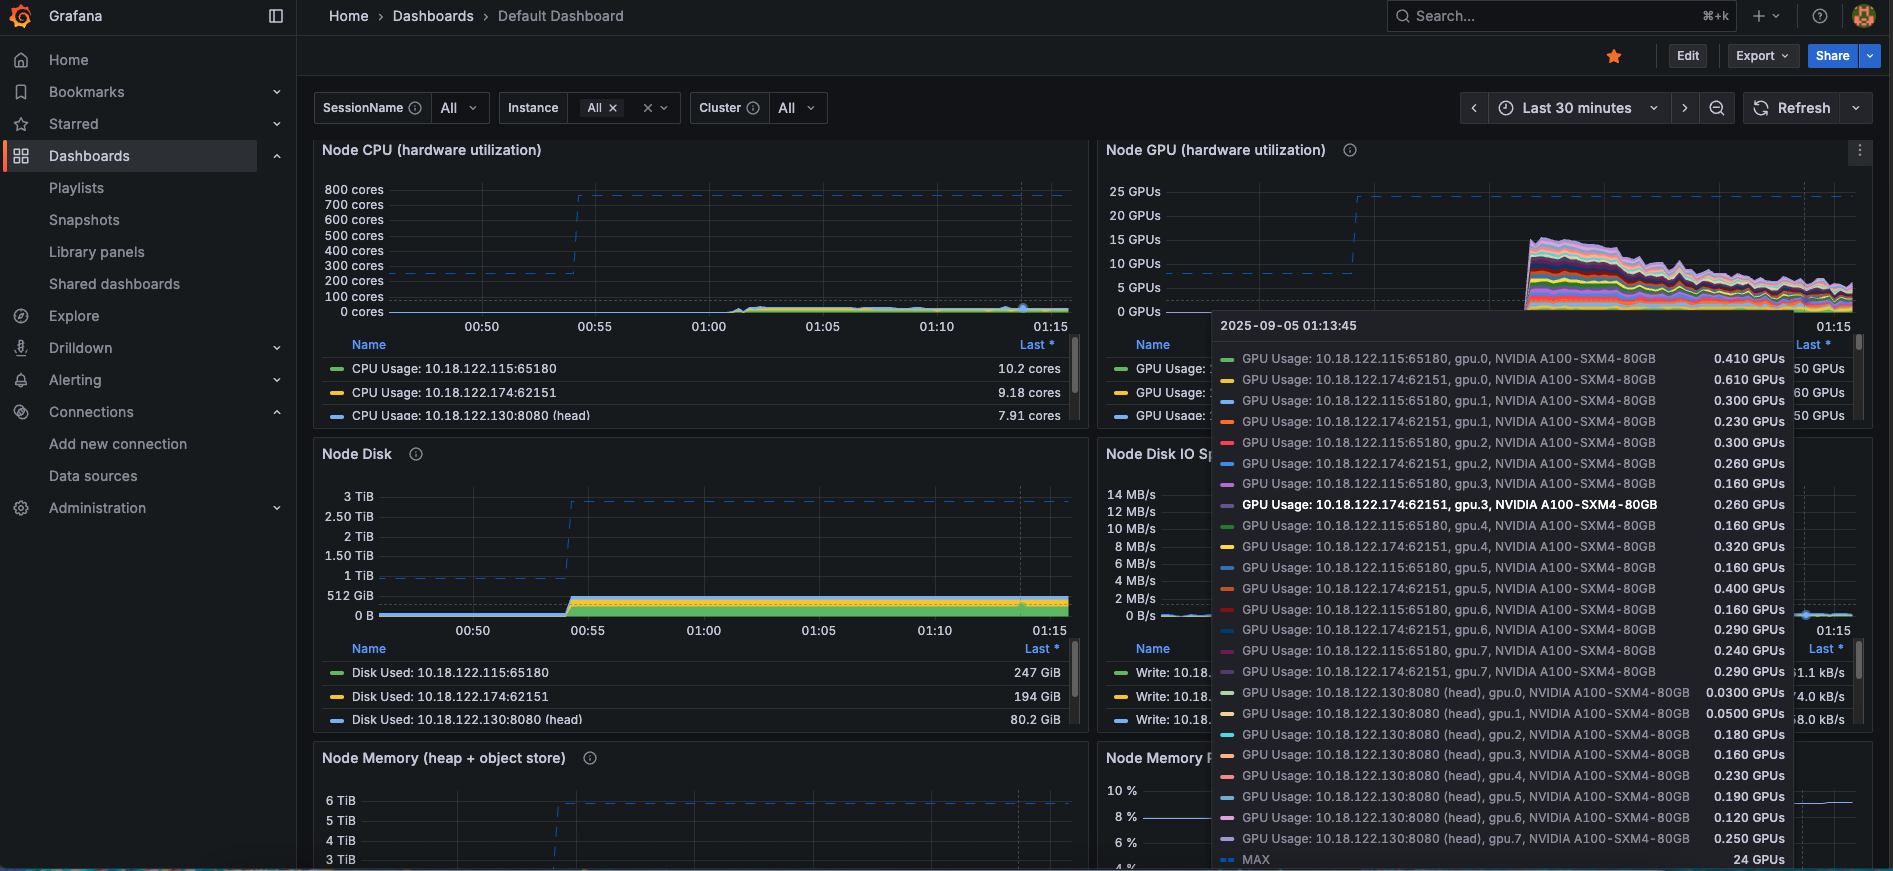
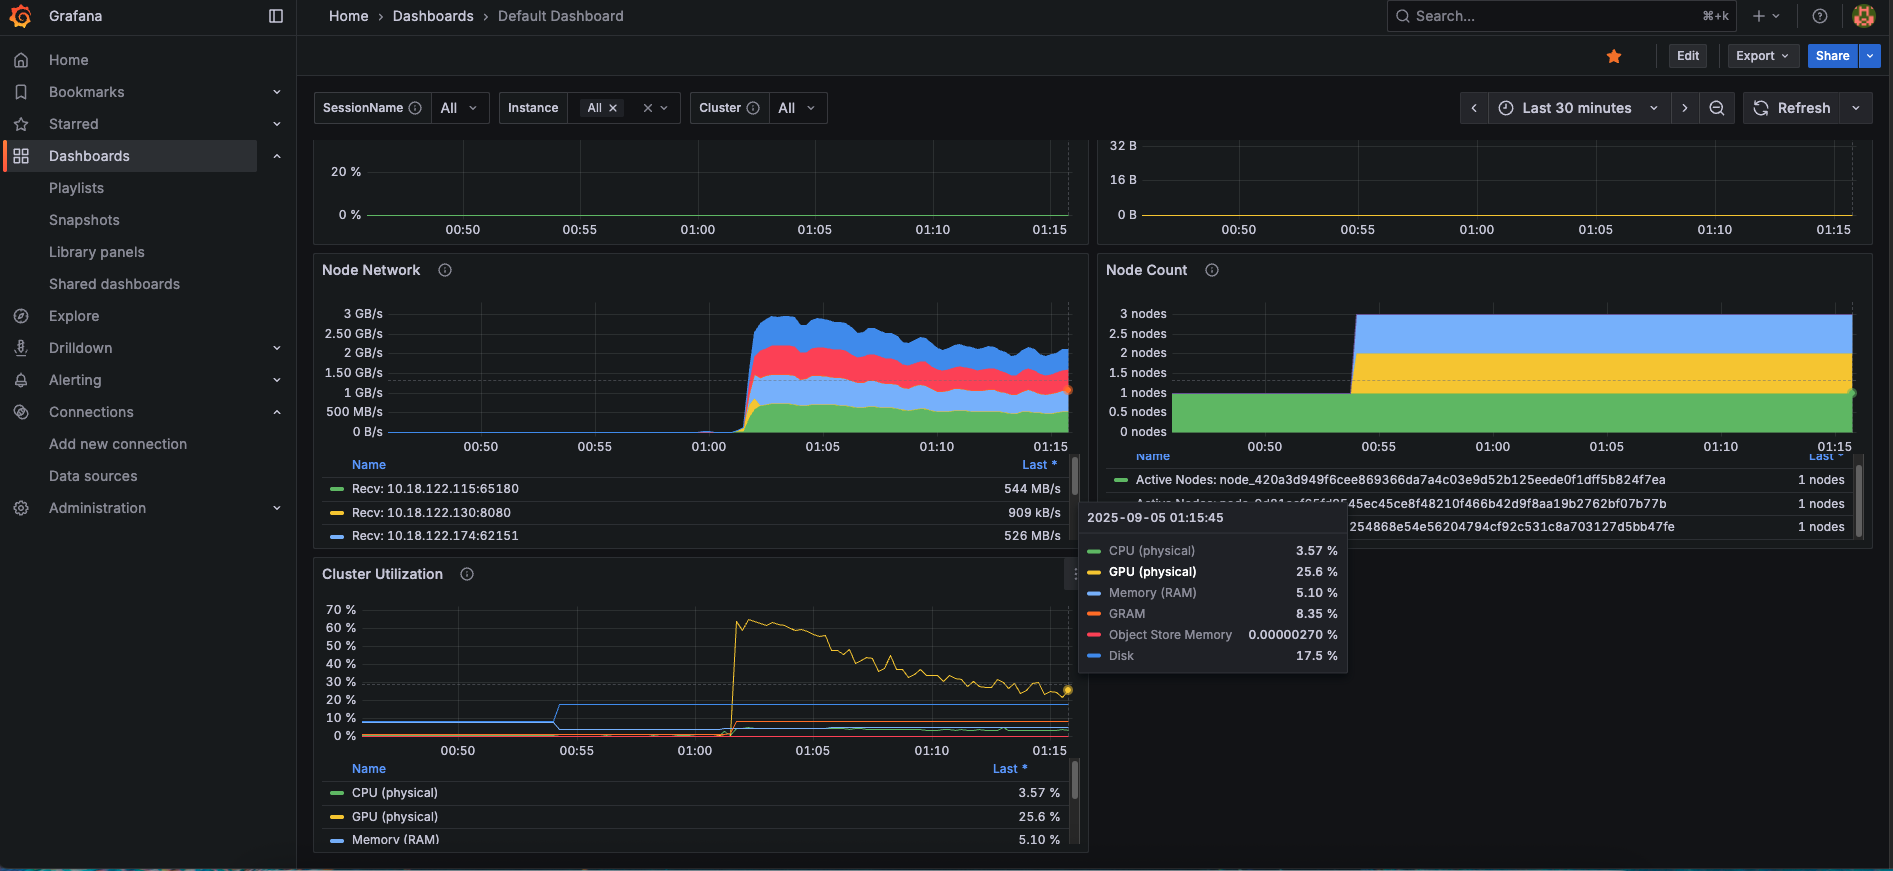
With Prometheus scraping Ray and the Grafana dashboard imported, you get node, actor, task, GPU, and memory visibility during training runs.